
What Are Data Analytics: Types, Techniques, Tools, and Future Opportunities
Technical education is vital to equipping students with current knowledge and inspiring future opportunities. This article helps to see the opportunities and future of data analytics. It is an introduction to data analytics, which currently stands at the forefront of technological evolution and innovation.
We aim to help students and educators recognize this domain’s burgeoning opportunities by covering its varied types, advanced techniques, and state-of-the-art tools. Understanding the future of data analytics is crucial for those preparing to enter a world where data drives decisions and innovation.
This guide serves as a beacon, highlighting the potential, challenges, and rewards that await in the ever-expanding universe of data analytics. Thus, it empowers our students to envision and seize their place in this dynamic future.
Key Takeaways
Data analytics is crucial for business growth: By uncovering hidden patterns and insights, data analytics allows businesses to make informed decisions, optimize operations, and improve their bottom line.
Different types of data analytics serve different purposes: Descriptive analytics helps understand past events, diagnostic analytics identifies the cause of an event, predictive analytics forecasts future trends, and prescriptive analytics provides insights for informed decisions.
Various data analytics techniques and tools are available: Regression analysis, factor analysis, cohort analysis, Monte Carlo simulations, and time series analysis. Tools range from traditional ones like Excel to programming languages like Python and R and specialized platforms like Tableau and Power BI.
What Is Data Analytics?
Data analytics takes raw, unstructured data and draws meaningful insights to improve business intelligence and decision-making. The goal is to provide actionable insights by discovering hidden relationships, trends, and patterns. The process involves using various tools, techniques, and methodologies. Users then leverage these to improve operations, products or services, and overall performance.
Data analytics plays a crucial role in supporting business growth and operations. By gaining a deeper understanding of their customers and market trends, businesses can better align their products and services with their customer’s needs and ultimately improve their bottom line.
Current trends in machine learning and AI have brought the importance of data analytics to fields such as medical research. By leveraging the knowledge hidden within our data, we can unlock valuable insights, not only in business.
Computation, in general, enhances several critical areas of clinical research, and AI-based methods promise even more applications for researchers. Despite not being in wide use so far, machine-learning systems already influence several areas of clinical research, such as appreciating the value of big data.
Eight ways machine learning is assisting medicine | Nature Medicine, Published: 13 January 2021
Why Are Data Analytics Important?
As technology advances, organizations face increasingly complex challenges in managing the vast amounts of data generated and collected. The data analyst now provides an ever-important role in these new challenges.
Data is often scattered across various departments and disparate systems, managed in outdated paper formats, or stuck in “Excel Hell.” The separation of data leads to data silos, making it challenging to build a holistic view of your data. The urgent need for people with data analytic skills creates opportunities in this tight job market.
In 2020, for the second time in four years, the number of jobs posted by tech companies for analysis skills—including machine learning (ML), data science, data engineering, and visualization—surpassed traditional skills such as engineering, customer support, marketing and PR, and administration.
Source: Data analytics skills shortage in tech | Deloitte Insights
Data analytics provides organizations with increased visibility into business processes and services. This insight can lead to operational optimization, reduced inefficiencies, and increased company profitability.
A great example is the insights gained from data analytics that can be used to create products that provide additional value to customers. For instance, an e-commerce company could use data analytics and basket analysis to determine which products resonate with its customers and create targeted product recommendations or bundles. (See Power BI: Basket Analysis Full Tutorial)
Data analytics can help organizations become more agile, efficient, and productive. By gaining a comprehensive view of their data, organizations can make informed decisions that drive growth and profitability.
In summary, with the growing amount of data generated, managing data has become more critical than ever. Data analytics gives organizations the insights they need to optimize operations, increase customer satisfaction, and stay ahead of the competition.
Who Is Using Data Analytics?
Data analytics is indispensable to driving insights and making decisions across various sectors. In this section, let’s explore some industries that rely on data analytics to aid decision-making.
Healthcare – Patient Outcomes
In the healthcare industry, data analytics helps to improve patient outcomes and reduce costs. Providers can monitor patient health and predict potential health issues and treatment plans, improving patient outcomes.
With the rising cost of healthcare, data analytics is also finding ways to streamline hospital operations. The goal is to optimize resource allocation to increase effectiveness and lower costs.
Emerging analytics tools based on artificial intelligence show the potential to assist physicians in day-to-day workflows.
Travel & Hospitality – Competitive Analysis
With the help of analytics tools, travel and hospitality companies can analyze customer data and gain insights into their preferences and behaviors. Businesses use the outcomes to personalize their services and provide a better customer experience. The travel industry is highly competitive and needs to optimize pricing strategies and improve marketing efforts to compete.
Manufacturing – Real-Time Analytics
Data analytics plays a crucial role in manufacturing by enabling companies to optimize operations, reduce costs, and improve productivity. The ability to have real-time data monitoring and analysis allows for predicting and acting on events before they become significant issues. Use cases include;
Detect and prevent quality issues before they hit the end user
Gain process efficiencies by monitoring production line performance and adjusting processes to optimize efficiency
Predict equipment failures and schedule preventive maintenance

Real-time dashboard with trend line and variances
Web Content Marketing & Education
Data analytics has revolutionized the content creation industry by enabling companies to understand how customers engage with their content. This traffic data allows for data-driven decisions to improve content quality and marketing strategies.
Content creators can monitor audience engagement metrics, such as time spent on a page, bounce rates, and click-through rates, to gain insights into what content resonates with their target audience. Data analytics allows for optimizing marketing campaigns by identifying the most effective channels and messaging.

Core Web Vitals – Largest Contentful Paint (LCP) issue: longer than 2.5s (desktop)
As data plays an ever more crucial role in decision-making, businesses must develop the necessary technical skills and invest in analytics tools and technologies to stay ahead of the competition.
Types of Data Analytics
Data Analytics is a critical tool that enables us to make sense of vast amounts of data. Various data analytics techniques are used to uncover hidden patterns, derive valuable insights, and make data-driven decisions to succeed.
Let’s review four of the industry’s main types of data analytics: descriptive, diagnostic, predictive, and prescriptive.
Descriptive Analytics – “What happened?” and “How did it happen?”
Descriptive analytics is the most basic type of analytics that helps us understand the past. By looking at insights into historical data, such as sales, products, or customers, we can identify trends and patterns. Answer “What happened?” and “How did it happen?“
Examples of real-world scenarios where descriptive analytics are applied include:
Analyzing sales data to determine the most popular product sold in a particular region.
Studying customer behavior to identify preferences and purchasing patterns.
Analyzing website traffic to identify popular content.
For example, in Power BI, you can Create a bar chart to analyze sales performance across different regions or a scatter plot to identify correlations between two variables. Then, create trend lines or time-series visualizations to visualize changes in key metrics, such as revenue or website traffic, over a specific period.
This helps you understand historical performance, make comparisons, and identify potential areas for improvement.
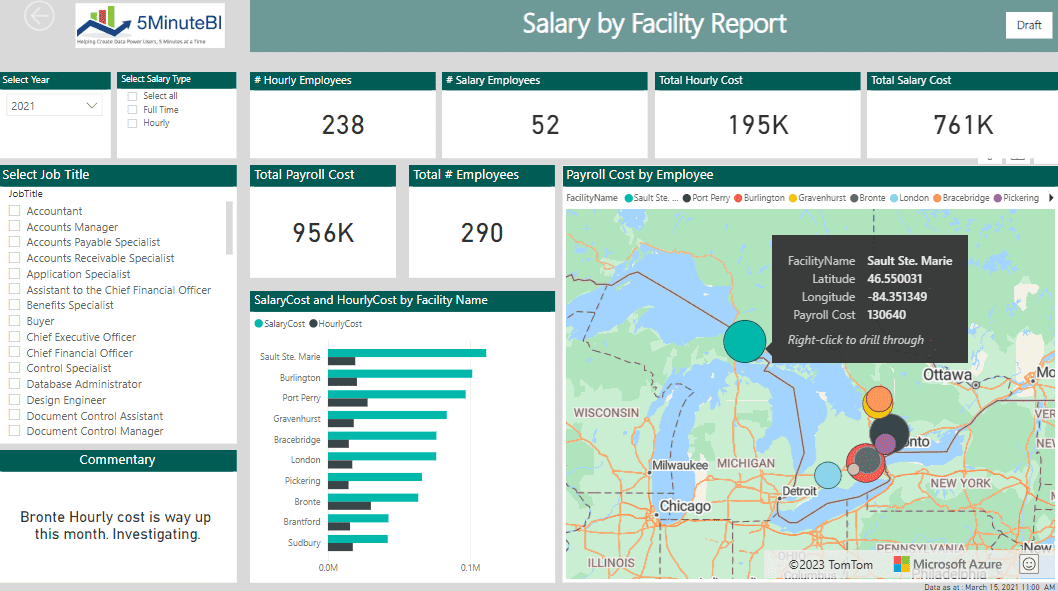
Power BI Descriptive Analytics with Interactive Drill Through to Detail
Diagnostic Analytics – Why did it happen? And What caused it?
Diagnostic analytics helps identify the cause of an event or performance issue. It provides a deeper understanding of why something has happened by analyzing historical data to identify correlations and relationships.
This answers questions such as “Why did it happen?” and “What caused it?“.
Examples of real-world scenarios where diagnostic analytics are applied include:
Investigating why customer returns have increased in a particular region
Analyzing production data to identify bottlenecks in the manufacturing process
Identifying the reason for customer churn
In the example below, Power BI can use a Decomposition Tree, which allows you to drill through to an AI Key influencer in the data set for that value.
More Information: Key influencers visualizations tutorial – Power BI | Microsoft Learn

Power BI Decomposition Tree allows you to drill through to AI Key Influencers.
Predictive Analytics – What is likely to happen? And What if scenarios?
Predictive analytics is a methodology that utilizes historical data and statistical algorithms to forecast future trends and behaviors. Machine learning models detect patterns, trends, and correlations that may not be immediately apparent.
Answering questions such as “What is likely to happen?” and “What if scenarios?“.
Examples of real-world applications of predictive analytics include;
Analyzing customer behavior to predict future purchasing patterns
Predicting equipment failure in manufacturing processes to prevent downtime
Forecasting sales revenue for the next financial year.
In the below example, the dataset shows the sales of a product over 365 days. This example shows that the data will be a simple linear relationship. Then, we’ll use linear regression to predict future sales. We can extend the line to use this to predict future sales.
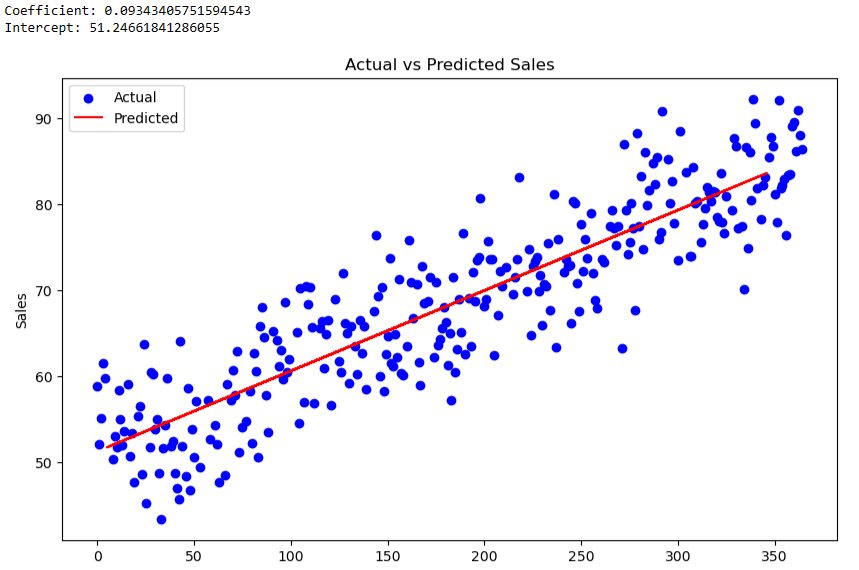
A scatter plot of the actual sales and a line plot of the predicted sales. The blue dots represent the actual sales data, and the red line represents the expected sales. The goal is to make the red line as close to the blue dots.
Prescriptive Analytics – What should we do? What is the best course of action?
Prescriptive analytics blends historical data, real-time data, and machine learning algorithms to provide insights that enable informed decisions. This answers questions such as “What should we do?” and “What is the best course of action?”.
Examples of real-world scenarios that this technique can be applied include;
Identifying the best offers and discounts for customers to improve sales
Determining the optimal time to launch a marketing campaign
Optimizing supply chain operations to improve efficiency
To close this section out. By utilizing descriptive, diagnostic, predictive, and prescriptive analytics, data analysts can gain valuable insights to make data-driven decisions. Whether analyzing sales data, predicting future trends, or optimizing supply chain operations, data analytics is a fundamental process that can help organizations succeed.
Data Analytics Techniques
There are several techniques to analyze and interpret data to gain valuable insights.
Regression Analysis – Relationship Between 2 Variables
Regression analysis is a statistical method identifying the relationship between two or more variables. This technique is used to determine the effect of one variable on another. For instance, regression analysis can determine how price changes affect sales volumes. However, its limitations include the reliance on assumptions and the need for a large amount of data to ensure accuracy.
Regression analysis has a wide range of applications; however, it is crucial to consider the investigation's assumptions. These include a linear relationship between the independent and dependent variables and the independence, normal distribution, and constant variance of residual errors.
As you see below, Python can be used to determine if or how strongly two variables affect each other. In this example, the body mass of penguins is predicted based on their flipper length. So, ‘body_mass_g’ is the dependent variable, and ‘flipper_length_mm’ is the independent variable. As the flipper length increases, the body mass of the penguin increases in a linear relationship.

Demonstration of how to use Python to conduct regression analysis using
Seaborn’s built-in penguins dataset
Factor Analysis – Grouping Variables
Factor analysis is a statistical technique that groups variables with similar characteristics to simplify data interpretation. It tries to find common underlying factors that explain the correlation between variables. This enables a better understanding of any relationships between data points and identifies important trends.
Factor analysis is used in market research, customer behavior analysis, and product development. Its main benefits include its ability to identify hidden patterns in data. Its main limitation is its reliance on subjective judgment when determining the number of factors to use.
Factor analysis is a statistical method that describes variability among observed, correlated variables in terms of a potentially lower number of unobserved variables called factors. For example, it is possible that variations in six observed variables mainly reflect the variations in two unobserved (underlying) variables. The observed variables are modeled as linear combinations of the potential factors plus “error” terms; hence factor analysis can be thought of as a special case of errors-in-variables models.
Source: Factor analysis – Wikipedia
The following example is from a Python Script for a dataset of 500 samples and five features. The first three features are correlated. The following heatmap represents the correlation of the original variables with the factors.
The heatmap numbers represent each variable’s loadings on each factor. In factor analysis, loadings are the correlation coefficients between the original variables and the factors. They measure how much each variable contributes to each factor.
Loadings can range from -1 to 1:
A loading close to -1 or 1 means the variable strongly influences the factor.
A loading close to 0 means the variable weakly influences the factor.
The sign of the loading (+ or -) indicates the direction of correlation between a factor and an original variable.

A loading close to -1 or 1 means the variable
strongly influences the factor.
So, Feature 1 has a strong positive influence on Factor 1, for example.
In the heatmap, warmer colors (towards yellow) represent higher absolute values of loadings (either positive or negative), while cooler colors (towards purple) represent loadings closer to zero. The heatmap provides an intuitive visual way to understand the structure of loadings and the relationships between original variables and factors.
Cohort Analysis – Customer Behavior Analysis
Cohort analysis is a technique for analyzing the behavior of a group of people with common characteristics over a specific period. For instance, it can be used to study the behavior of customers who joined a company during a particular period and compare it with those who joined later.
A cohort is a group of subjects who share a defining characteristic (typically subjects who experienced a common event in a selected time period, such as birth or graduation).
Source: Cohort (statistics) – Wikipedia
Cohort analysis allows us to identify trends in customer behavior, preferences, and needs, which can inform marketing and sales strategies. One of its primary uses or benefits is its ability to provide a clear picture of the performance of different customer cohorts. In contrast, its limitations include the need for high-quality data and the challenge of isolating the effects of external factors.
Monte Carlo Simulations
The Monte Carlo Method uses algorithms to generate many random outcomes to estimate the probability of certain events. This technique is helpful in risk assessment, scenario planning, and decision-making. Monte Carlo simulations can be applied in various business areas, such as project management, finance, and product development.
Its benefits include its ability to generate forward-looking insights that can inform decision-making, while its limitations include its dependence on assumptions and the need for specialized technical skills.
Monte Carlo methods, or Monte Carlo experiments, are a broad class of computational algorithms that rely on repeated random sampling to obtain numerical results. The underlying concept is to use randomness to solve problems that might be deterministic in principle. (Monte Carlo method – Wikipedia)
Time Series Analysis
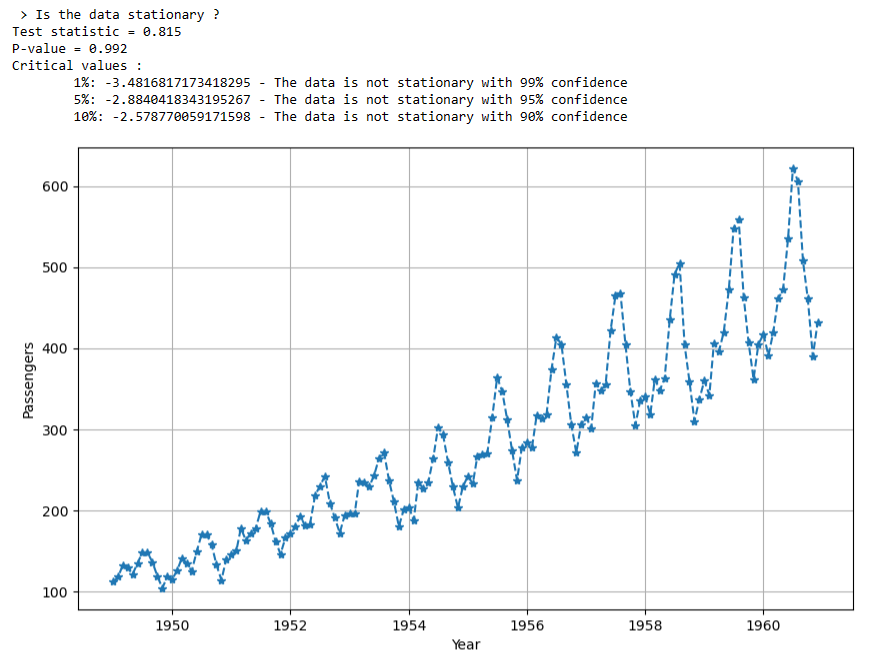
One of my favorite techniques from my retail analytics past is time series analysis. This involves analyzing data to identify patterns and trends over time. This technique helps forecast future trends, seasonal patterns, and cyclical trends. Time series analysis can be used in different business areas, such as sales forecasting and financial and economic analysis.
An essential factor in the data points’ analysis is that they are recorded at regular intervals for a predetermined duration rather than sporadically or haphazardly. Its benefits include its ability to provide insights on trends and patterns over time, while its limitations include the need for high-quality data and the challenge of accounting for external factors.
For an excellent overview, see The Complete Guide to Time Series Analysis and Forecasting | by Marco Peixeiro | Towards Data Science.
Time series forecasting occurs when you make scientific predictions based on historical time-stamped data. It involves building models through historical analysis and using them to make observations and drive future strategic decision-making. Quote Source: Time Series Forecasting: Definition & Examples | Tableau
To sum it up, the appropriate data analytics technique depends on the nature of the data being analyzed and the specific questions being asked. Each method has strengths and limitations, and businesses should consider these factors when selecting a technique. Ultimately, the main goal of using data analytics is to derive actionable insights that can inform business decisions and improve overall performance.
Data Analytics Tools
Data analytics is a rapidly growing field that is becoming more difficult to navigate. The wide variety of analytical tools has made it more difficult to select products that help businesses achieve their goals.
Some popular data analytics tools include Python, R, Tableau, Power BI, SAS, Data Bricks, and Apache Spark. Each performs different functions, ranging from data acquisition to reporting, and they have revolutionized how data analysts work.
The key to analytics is having the correct tool for the right task. The benefit today is that many tools provide a complete end-to-end workflow path.
Microsoft Excel – The Go-To Powerhouse for Data Analytics
Excel, part of the Microsoft Office suite, is a widely recognized and indispensable analytical tool because of its simplicity, flexibility, and pervasiveness.
Excel is often the first point of contact for many when dealing with data. It offers functionalities such as data entry, manipulation, and statistical analysis. Excel’s strength lies in its grid of cells, which allows for intuitive data structuring and manipulation. The ability to create dynamic reports and charts makes Excel an excellent tool for initial data exploration and visualization.
Excel’s strength is its flexibility and rich set of built-in formulas and functions that easily enable complex calculations. Pivot tables provide a robust framework for summarizing, sorting, reorganizing, and grouping data, offering a straightforward approach to extracting insights.
Excel includes Power Query, which provides an end-to-end data workflow from acquisition through manipulation and preparation. With no effort, you can visualize basic profiling information of the data you are importing using the data profiling tools pictured below.
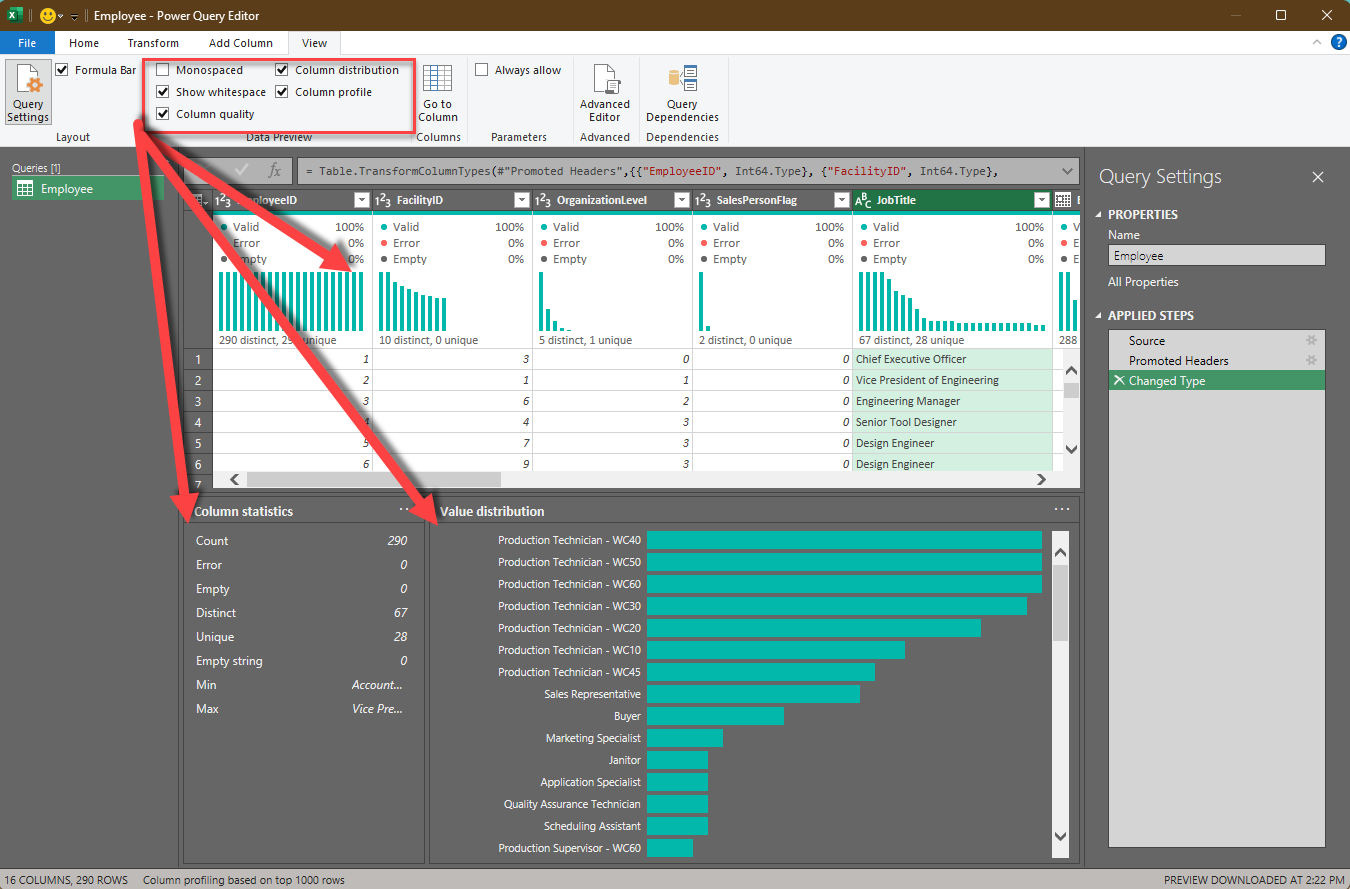
The data profiling tools provide intuitive visual ways to clean, transform, and understand data in Power Query Editor. These include column quality, column distribution, and column profile.
However, Excel has its limitations. Excel can slow down significantly when dealing with large datasets. Though quite large, its capacity limit might prove insufficient for significant big data needs. Also, while it has data visualization capabilities, they’re less powerful, interactive, or sharable than those in more specialized tools like Power BI or Tableau.
Additionally, Excel lacks advanced analytics capabilities inherent to programming languages like Python or R. While it does offer some statistical analysis features, they are less comprehensive and lack the sophistication required for more complex tasks such as machine learning.
In summary, while Excel might not be the ultimate tool for data analytics, it is a powerful, versatile starting point crucial in any data analyst’s toolkit.
Python and R – Programming Powerhouses in Data Analytics
Python and R are indispensable tools in the data analyst’s toolbox. As programming languages, they offer significant flexibility and efficiency in processing large datasets. They can also cover the entire analytics self-service workflow model – from data acquisition to data preparation to visualization and insights generation.
Python and R come with their strengths, offering various functionalities. They are used for various tasks, from cleaning and manipulating data to implementing complex statistical modeling and machine learning algorithms.
What makes them especially appealing is their extensive library of packages. For Python, libraries such as Pandas for data manipulation, Matplotlib, Seaborn for data visualization, and Scikit-Learn for machine learning are commonly used. In R, popular package choices include dplyr for data manipulation, ggplot2 for data visualization, and caret for machine learning.
Both tools are open-source and boast a large, active community for support and resource sharing. They offer excellent scalability and can handle large, complex datasets relatively easily. Furthermore, these languages enable seamless integration with other tools and platforms, increasing their versatility in the data analytics pipeline.
However, using Python and R also comes with a set of challenges. Both have a steep learning curve, especially for those new to programming. While powerful for analysis and modeling, they can be resource-intensive when handling large datasets, making efficient code necessary.
Tableau and Power BI – All-in-One Self-Service BI
Tableau and Power BI are robust data visualization platforms that offer a comprehensive environment for creating interactive and engaging dashboards and reports. These tools support a highly intuitive drag-and-drop interface that enables users to develop point-of-thought interactions in their data storytelling, unveiling trends and patterns that were otherwise buried. This interactive nature helps articulate insights effectively to stakeholders, making data storytelling easier.
These platforms pose significant advantages. They democratize data, making it accessible to individuals with minimal technical proficiency. By offering real-time updates, they empower businesses to react promptly to changes in data. They’re also scalable, adjusting to the size and complexity of data as companies grow. Moreover, they facilitate data blending, pulling data from numerous sources to create holistic views of business performance.
However, these tools also have their share of challenges. Tableau and Power BI often demand significant investment, especially for larger organizations. While their user-friendly nature is there, they may still require some training to fully leverage their potential.
Lastly, while excellent for data visualization, these tools don’t support complex data processing tasks as efficiently as specific programming languages like Python or R.
SAS – Traditional Powerhouse in Data Analysis
SAS (Statistical Analysis System) has a long history in analytics, offering a comprehensive suite of software for analytics. SAS serves a broad spectrum of analytical needs, from data integration and transformation to predictive modeling and reporting. It’s a proprietary tool with a legacy spanning several decades, thus making it a trusted choice for large corporations.
One of SAS's standout benefits is its robustness and comprehensive nature. It allows for various operations, including predictive analytics, data management, and multivariate analysis. Additionally, it offers superior technical support, which can be critical when dealing with complex analyses.
However, SAS also presents some challenges. First and foremost, it’s quite expensive, making it less accessible for smaller businesses or individual analysts. Furthermore, the learning curve for SAS can be steep, particularly for those without a programming background.
Apache Spark – Large-Scale Data Processing Tool
Apache Spark is a leading distributed computing system designed to handle large-scale data processing and analytics tasks. It offers a unified analytics engine capable of processing data from various sources, including, but not limited to, Hadoop Distributed File System (HDFS), Cassandra, Azure, and Amazon S3. Spark’s rise to fame lies in its parallel processing capabilities in memory, allowing it to handle data faster and more efficiently than many traditional data analytics tools.
The primary advantage of Apache Spark is its remarkable speed, as it performs processing tasks in memory. It also supports multiple programming languages, offering developers flexibility. Furthermore, its ability to process real-time data makes it an excellent choice for streaming analytics.
However, as powerful as Spark is, it has its challenges. Managing Spark’s infrastructure can be complex, especially in large-scale deployments. Moreover, it might be overkill for small data sets, and using it in such scenarios could lead to inefficiencies. Lastly, while it offers speed and scalability, it might require significant resources, which can be a limiting factor for some organizations.
In conclusion, the vast array of data analytics tools has revolutionized the analytics field and enabled data analysts to deliver valuable insights to their companies. Adopting these tools has allowed businesses to make data-driven decisions that help them achieve their business goals. Data analysts must understand the differences between the tools and select the most suitable one for their needs.
Conclusion
Data analytics is a powerful tool that enables businesses to make informed decisions based on insights derived from data. With the ability to uncover hidden patterns, correlations, and insights, data analytics plays a crucial role in various industries, including healthcare, travel and hospitality, manufacturing, and web content marketing.
By leveraging different types of data analytics—descriptive, diagnostic, predictive, and prescriptive—businesses can optimize operations, increase customer satisfaction, and stay ahead of the competition. The choice of data analytics techniques and tools depends on the nature of the data and the specific questions being asked. Ultimately, data analytics aims to provide actionable insights to drive business growth and profitability.
FAQ
Q1: What is the importance of data analytics in business?
Data analytics is important in business as it provides insights that can lead to better decision-making, operational optimization, reduced inefficiencies, and increased profitability. It allows businesses to better understand their customers, align their products and services with customer needs, and improve their bottom line.
Q2: What are the different types of data analytics?
The four main types of data analytics are descriptive, diagnostic, predictive, and prescriptive. Descriptive analytics helps understand what has happened in the past, diagnostic analytics identifies the cause of an event, predictive analytics forecasts future trends, and prescriptive analytics provides insights that enable informed decisions.
Q3: What tools and techniques are used in data analytics?
Data analytics utilizes various tools and techniques. Tools include traditional ones like Excel, programming languages like Python and R, and specialized platforms like Tableau and Power BI. Techniques include regression analysis, factor analysis, cohort analysis, Monte Carlo simulations, and time series analysis.
Learning Resources for Data Analytics
Here are some learning resources for Data Analytics:
Microsoft Learn: Analyzing and Visualizing Data: This learning path from Microsoft provides several modules that cover data exploration, analysis, and visualization using Power BI.
Codecademy: Learn Data Analysis with Python: This course from Codecademy covers data analysis using Python, including how to work with data using libraries like pandas and matplotlib.
Tableau Learning Resources: Tableau provides a wealth of resources for learning how to use their software for data visualization and analysis.
DataCamp: Introduction to Data: This course from DataCamp introduces data science using Python, including how to work with data using the pandas library.
Kaggle: Learn Data Science: Kaggle provides several free courses that cover various aspects of data science, including data visualization, machine learning, and data cleaning.
Apache Spark Documentation: The official documentation for Apache Spark, a large-scale data processing tool, provides a wealth of information for learning how to use Spark for data analysis.
Remember, the best way to learn data analytics is by doing. Try to apply what you learn to real-world data sets and problems. This will help you understand the concepts better and give you practical experience to showcase in your portfolio.