
From Chaos to Clarity: Leveraging AI In The 8 Stages of Data Preparation
Data is critical for organizations across all industries in today’s digital age. However, the raw data businesses collect is often unstructured and cluttered, making it challenging to extract value effectively. If you want to use data for AI, you must have clean data; otherwise, the benefits of integrating AI will be lost.
Exploring the intricacies of data engineering in today's AI-driven landscape reveals that integrating AI with conventional data practices represents a fundamental transformation, ushering in more dynamic, predictive, and efficient data environments.
This introduction sets the stage for a detailed discussion on how AI is specifically impacting each stage of data preparation, aligning with the evolving needs and capabilities of modern data engineering.
Data engineering is a crucial foundation in data analytics. It converts disorganized raw data into well-organized, actionable insights. Artificial Intelligence (AI) technologies have recently transformed this field by introducing new automation, preparation, and optimization levels.
Why AI & Machine Learning
AI and machine learning (ML) enhance existing data engineering processes and redefine possibilities. These technologies automate labor-intensive tasks that traditionally require extensive human efforts, such as data cleaning, transformation, and integration. By leveraging AI, data engineers can focus on more strategic elements of their roles, like designing data architectures that meet current analytical needs and are scalable and forward-thinking.
AI integration in data preparation addresses several challenges by enhancing accuracy, reducing time-consuming manual errors, and enabling faster decision-making through real-time data processing. AI-driven tools can quickly handle vast volumes of data, ensuring that businesses can leverage their data assets more effectively and with greater agility.
First, some definitions.

Data Engineering can connect data from a wide variety of sources in a wide variety of formats.
What Is Data Engineering
Data engineering is an essential skill in transforming raw data into actionable insights. It involves designing and managing systems that efficiently handle, store and analyze data.
Data engineers develop architectures and pipelines for data flow, focusing on accessibility, reliability, and security. Their expertise in database technologies, data modeling, and ETL / ELT processes is essential for preparing data for analysis. This field is foundational to effective data analysis and machine learning, as it ensures the organized and optimized management of data from its source to its final use.
Data preparation enhances efficiency and effectiveness. Data engineers create systems for automated data collection, cleaning, and transformation, ensuring smooth integration of diverse data sources. Their role is pivotal in blending and standardizing data, which is key to robust data analysis.
Process performance is an essential responsibility in data engineering. By optimizing data infrastructure, data engineers streamline data preparation and amplify the analytical capabilities of data scientists. They make the data clean and structured for maximum analytical value.
What is Data Preparation?
Data Preparation involves collecting, cleaning, transforming, and organizing raw data into a format suitable for analysis or modeling. Let’s break this into eight stages of Data Preparation;
| Data Preparation Stage | Purpose and Benefits |
|---|---|
| Why is Data Preparation Important? | In this step, you mainly remove errors, duplicates, and irrelevant data to ensure the data’s accuracy and consistency based on the results of the exploration phase. |
| Collecting Data | Bring data from various sources such as databases, websites, and even Excel spreadsheets from end users. |
| Exploring the Data | Data can be converted into a form that can be easily analyzed, such as normalization, scaling, or dimensionality reduction. |
| Cleaning Data | In this step, you mainly remove errors, duplicates, and irrelevant data to ensure the data’s accuracy and consistency. |
| Transforming Data | Once the data is clean, you can combine multiple sources. However, you still need to ensure it is consistent in format and structure. |
| Data Integration | Once the data is clean, you can combine it from multiple sources and ensure it’s in a consistent format and structure. |
| Data Enrichment | Adding new data to the existing dataset through external sources or data generation techniques. |
| Operationalizing | Automating and streamlining the tasks to improve efficiency, repeatability, and scalability. |
This table outlines the reasons for each data preparation stage and its importance.
Stage 1. AI’s Role in Elevating Data Preparation
When you get deeper into a data analysis project, your chance of failure or delay is significantly higher if the data you are working with has any issues. If you discover data problems once you have started designing or building your solution, these issues could be catastrophic to your timeline and budget.
Many studies examine the importance of Data Preparation;
Data preparation activities such as loading and cleaning accounted for 45% of data scientists’ time, according to a survey from Anaconda. Source: alteryx.com
Data preparation accounts for about 80% of the work of data scientists. Source: forbes.com
Data preparation is essential to the data process and can be challenging to complete correctly. A Talend.com survey found that 76% of data scientists considered data preparation the least desirable aspect of their job, yet it is also critical for making well-informed and accurate business decisions.

76% of data scientists considered data preparation the least desirable aspect of their job
If you make a mistake, your end users will lose faith and trust in your work. One of the most important aspects of my analytical projects was being careful and finicky when preparing raw data to ensure high-quality resulting data.
It is very important to be able to reuse data. You spend a great deal of time collecting and processing data. Do a good job on this data set; you can use your output as input in subsequent analysis or as a source later in your data chain.
AI Predictive Models – Proactive Guardians of Data Quality
In this new age of data preparation, AI predictive models stand as the first gate, confirming the integrity and utility of data before it becomes a source of truth in your business intelligence pipeline. The start of AI in this initial stage can revolutionize how we approach data quality. Even with manual data entry, using AI at an early stage helps clean up data before it enters the chain.
AI-powered predictive models are designed to identify and flag potential data quality issues proactively. Previously, this task was reactive and occurred only after problems had been detected, often too late in the process workflow.
Remember to log changes and keep track of the changes your data takes. Always be able to prove the final result and keeping a record of data changes is one of the main ways to prove your data story.
These models use historical data patterns and machine learning algorithms to predict the types of errors and inconsistencies that can arise. By doing so, they effectively anticipate the need for data preparation before the data is ingested into analytical pipeline.
The proactive nature of AI tools means they can assess the likelihood of missing values, outliers, duplicate entries, and discrepancies that human operators might overlook. This proactive stance is a lot like a diagnostic tool in healthcare—it does not wait for the illness to manifest but instead looks for indicators that can prevent it altogether.
Consider a typical scenario:
An AI model is trained on a dataset that includes a history of transactions, customer feedback, and prior data quality issues. It learns from this data to recognize the subtle signs of data decay, such as irregularities in data entry patterns or anomalies in transaction volumes. Once deployed, it monitors incoming data streams continuously, alerting engineers to anomalies that may signify deeper data quality issues.
This early detection is critical. It allows data engineers to intervene early, saving significant time and resources that would be spent rectifying issues downstream. By ensuring that the data is of the highest quality at the outset, predictive models streamline the entire data pipeline, making subsequent stages of data preparation, like cleaning and transformation, far more efficient.
Moreover, AI-driven predictive models help establish a baseline for what ‘good’ data should look like. They contribute to setting data governance standards and practices, leading to a culture where data quality is not just an operational requirement but a strategic asset.
Through these intelligent systems, we are shifting from a reactive approach to a predictive one, where data quality is managed as an ongoing process rather than a series of checkpoints. This paradigm shift enhances the data preparation process and ensures that the foundations upon which critical business decisions are made are solid and reliable.
Stage 2. Critical Elements of Data Collection
Data collection is a critical aspect of any data preparation. You bring data from various sources such as databases, websites, and even Excel spreadsheets from end users.
“The success of your end product will depend on the decisions you make in the data collection phase.”
Here are some key aspects to consider when collecting data:
Defining the Goals and Requirements – Define the purpose of your data collection, including the research question, goals, and objectives. Clear definitions of requirements, goals, and narratives can enhance the significance of your analysis while minimizing the effort required to obtain relevant information.
Data sources—Identify the data sources, including primary sources, such as surveys and interviews, and secondary sources, such as public records and databases. In larger environments, you need data security requirements or to obtain permission to use data, which might take time. You also need to consider how volatile the data is, the update schedule, and whether you must set up a refresh routine.
Data Discovery—The first step is determining your data through Data Profiling. You evaluate and examine the data to see any patterns or trends, look at labels, null values, and data types, and look for data that could cause errors later in the process. You can sample the data and provide a profile.
There are many ways to do this manually or develop a more automated process. The main output of this step is to examine, analyze, and create summaries to learn more about the data source, data sample, or data set.
The example below is Power BI’s Power Query, which provides the user with data profile functionality within the tool.
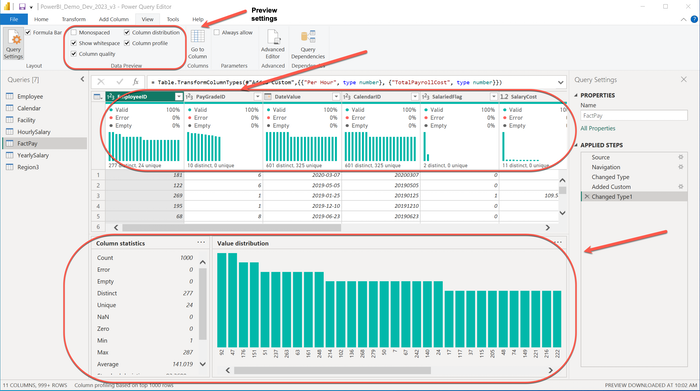
Data Profile and Discovery using Power BI’s Power Query
Instrumentation—Develop and test data collection routines or orchestrations to automate data collection. You could use tools such as questionnaires or sensors, and you must ensure they capture the data needed. Whether you think this analysis or project is a one-time endeavor, I was always asked to reproduce or update the analytics even a year or so later. Always keep notes and sources.
Data quality – This is perhaps the most critical aspect of your reputation. Through careful design and monitoring, you must ensure the data collected is accurate, reliable, and valid. (Ref: https://flandes-editorial.com/como-calcular-el-area-de-un-rectangulo)
Data storage—Choosing an appropriate method for storing, managing, and securing your data, such as databases or cloud storage, MUST be done to protect confidentiality and privacy. How long you store the data and other data governance concerns must be examined and documented at some point.
Data analysis—Plan for data analysis from the start, including selecting appropriate statistical methods, software, and tools. You also need to ensure you have all the base data for calculations. For example, if you want to look at “This Year vs. Last Year,” you need last year’s data.
Suppose you want to examine calculations in the source data, such as margin percentage, for example. In that case, you need the base data and the right grain or detail for the calculation that was obtained in the source system. As you roll up the data, your calculations will be correct.
Ethical considerations – Ensure that the data collection follows ethical guidelines and principles, such as confidentiality and transparency. A great article by Catherine Cote of the Harvard Business School had a great definition;
“Data ethics encompasses the moral obligations of gathering, protecting, and using personally identifiable information and how it affects individuals.” Source: 5 PRINCIPLES OF DATA ETHICS FOR BUSINESS.
Your data collection must consider key aspects to obtain relevant, accurate, and reliable data for meaningful analysis.
AI-Powered Data Collection – Automating the Harvest of Data
The collection phase is a critical point in the pursuit of turning data into a strategic asset. Stage 2 of data preparation is where AI-powered tools genuinely begin to shine, offering automated solutions that harvest both structured and unstructured data from a myriad of sources with remarkable efficiency. The collection phase is a critical moment in the goal of turning data into a strategic asset.
Traditional data collection methods often involve labor-intensive processes prone to error and inconsistency. The emergence of AI in this domain has been transformative as it employs intelligent systems capable of navigating and extracting data from complex landscapes with minimal human intervention.
AI-powered data collection tools can parse databases, scrape web content, sift through social media streams, and even decipher images and videos for relevant information. They use sophisticated algorithms, such as natural language processing (NLP) and computer vision, to recognize and extract valuable data points from documents, webpages, and other digital content that would otherwise require extensive manual effort.
These tools are not just robotic extractors; they possess the cognitive ability to understand the context of the data they collect. For instance, Natural Language Processing (NLP) algorithms can discern sentiment in customer reviews, classify them accordingly, and prepare datasets for further analysis in customer behavior studies. Similarly, computer vision AI can identify and categorize visual elements in images, making it possible to tag and organize visual data at scale automatically.
One of the standout advantages of AI in data collection is the sheer volume of data that can be processed. AI tools can operate around the clock, ingesting data at a rate that is orders of magnitude greater than manual methods. This capability ensures that large datasets are not just a possibility but a standard expectation in contemporary data analysis.
Moreover, these tools are adaptive; they learn from the data they collect. This continuous learning loop allows them to refine their data collection strategies over time, improving their accuracy and relevance. As they encounter new data types or sources, they adjust their algorithms accordingly, ensuring that the datasets they produce are comprehensive and up-to-date.
The big win in using AI with data preparation transforms data collection from a time-consuming, sometimes error-prone chore to a strategic operation. By automating the extraction process and enabling the handling of vast and varied data types, AI-powered tools are setting the stage for a more robust and insightful data analysis that follows.
Stage 3. Data Exploration – What Do You Have?
Data exploration is crucial in data analysis. It allows analysts to understand the data better and make informed decisions about data preprocessing and required methods for further analysis.
Unstructured data makes up 80% of data today. Source: aws.amazon.com
This can also be called Data Profiling, which involves analyzing the dataset to identify patterns, relationships, and anomalies that can be used to enhance the dataset and provide additional insights. Here are some of the ways you can use data exploration to discover what you have;
Identify the variables – By exploring the data, you can identify the variables in your dataset and understand their distribution, range, and possible values. This will help design and develop any spreadsheets, databases, or models. Determining any data you do not require is important at this stage as it may interfere with your analysis.
Check for missing values – Data exploration helps you identify missing values in the dataset, which can be critical for data cleaning and inference. There are a couple of items to consider when you are looking at missing values;
Can you replace, estimate, or fill in any missing values?
Can you find other sources?
Do the missing values impact the validity of your analysis?
Examine distributions – You can use visualizations and descriptive statistics to examine the distributions of the variables in the dataset. The distribution of a variable refers to how the different values are spread across your dataset. You are looking for what patterns you see in the data. Is there anything unusual? Some tools include mean, median, minimum and maximum, and standard deviation statistics.
AI’s unsupervised exploration provides a double-edged sword of neutrality – it is not swayed by human hypotheses or expectations, allowing for an unbiased view of the data. This objectivity ensures that subsequent decisions and analyses are based on genuine data-driven findings rather than preconceived notions.
However, you always need to be careful of any biases the AI Models might have, as these can significantly impact the fairness, accuracy, and ethical implications of AI systems. Bias in AI often stems from the data used during the training phase, which may reflect historical inequities, social stereotypes, or uneven representation.
If the training data is skewed or incomplete, the algorithm may inadvertently perpetuate or even amplify these biases in its decision-making processes. This can lead to unintended consequences, such as discriminatory hiring practices, biased credit approvals, or unfair sentencing recommendations. Addressing bias requires a proactive approach, including diverse and representative datasets, rigorous testing for fairness, and implementing transparent algorithms with mechanisms to mitigate inequities.
It’s essential for developers and organizations to prioritize these practices to build AI systems that are equitable, reliable, and beneficial for all users.
Remember that you cannot replace the human element; even just scanning the values can reveal patterns that might not be apparent to a machine. Questions such as: Why is December so large? For example, oh ya, that was Christmas. Why are this store’s sales zero? Ah, yes, the renovation.
Identify patterns and relationships – Data exploration allows you to identify patterns and relationships in the information, such as correlations or trends. Are there comparisons you can use in visualizations or trends that you can use to help your analysis?
We use Python to examine 3 data sets in the following example diagram. We calculate the correlation coefficientsnumpy.corrcoefand plot the data points usingmatplotlib.pyplot.scatter. We can see the strong and weak correlations.
3 datasets with different Correlation strengths: Strong, Weak, and almost no correlation.
Determine outliers – You can use data exploration techniques to identify outliers, which are values significantly different from other values in the dataset. These are not errors but may be items you need to explain if they throw off or mislead possible results. If your observations are all between 1 and 5 but have one that is 10, this could require more information. Is this an error or a possible result?
Evaluate data quality – By exploring the data, you can identify potential errors or inconsistencies and take steps to correct them. With these explorations, you can determine the data’s quality and fitness for use. Data may be of poor quality but still helpful in explaining some information.
Overall, Data Exploration allows individuals to comprehensively understand their dataset, which includes assessing data quality, identifying variable relationships, and detecting patterns suitable for analysis and decision-making. This is one of the more important steps for data preparation for machine learning.
AI-Enabled Data Exploration – Unearthing Hidden Patterns Without Bias
AI’s unsupervised learning techniques have emerged as powerful tools, automating the discovery of hidden structures within vast datasets without human preconceptions or biases.
Unsupervised learning, a machine learning algorithm that operates without labeled outcomes, can identify patterns and relationships in untagged data. These algorithms sift through datasets, seeking out natural clusters and variations that might indicate important features or anomalies that warrant a closer look.
AI’s role in data exploration is multifaceted:
Clustering – AI systems use K-means or hierarchical clustering algorithms to group similar data points. This is crucial in segmenting data into meaningful categories, such as customer types in a sales database or patient profiles in medical records, without predefined labels guiding the process.
Dimensionality Reduction—AI uses techniques such as Principal Component Analysis (PCA) or t-distributed Stochastic Neighbor Embedding (t-SNE) to clarify high-dimensional data into a more manageable form while preserving its essential characteristics. This simplification helps visualize complex data and reveal patterns that might be obscured in higher dimensions.
Association Analysis – AI uses algorithms like Apriori or Eclat to explore relationships between variables. It can uncover rules that highlight common co-occurrences within the data, such as items frequently purchased together, informing strategies for cross-selling or store layout.
Anomaly Detection – Unsupervised algorithms are adept at flagging data points that deviate from the norm, signaling potential outliers or errors. This automatic detection is vital for quality control and preemptive correction before further data processing.
By harnessing these techniques, AI transforms the exploratory phase into a systematic and thorough process. It can process information at a speed and scale beyond human capacity, allowing patterns and insights to surface rapidly, which could can go unnoticed by the human eye.
Stage 4. What is Involved in the Data Cleaning?
In the Data Cleaning step, you mainly remove errors, duplicates, and irrelevant data to ensure accuracy and consistency based on the exploration phase results. This can be one of the most challenging yet important steps if you are evaluating the data for the first time.
The outcome is correcting inaccurate data or problems with the data feed. Always go back to the source. Could a data collection issue be corrected for future data feeds?
Be sure to make notes and provide details about what you are doing. You must always show your work and back up any decisions you make at this stage. Decisions here could affect the analytics results, and you must always explain your work! You may have many people downstream using this data, and they need to know what changes are made. Keeping a changelog is always a good idea.
Here are some of the steps that can be involved in cleaning the data:
Identify and remove duplicates – Check for any duplicate data points in the dataset and remove them to avoid skewing the analysis. To avoid removing important information, you must carefully define if data is duplicated. This can include entering data twice, missing some range, or using a different scale or measurement.
Handle missing data – When dealing with missing data, it’s essential to consider factors such as the type and extent of the missing data. ALWAYS think of how it’s likely to affect the analysis. Based on these considerations, you may choose an appropriate strategy, such as assigning a value based on the existing data or even deletion.
Address outliers – Identify outliers significantly different from other data points and determine whether to remove or adjust them. The key is not to remove meaningful data. Is it erroneous data or a result you need to evaluate?
Standardize data & Resolve inconsistencies – Ensure the data is in a consistent format and standardize the data types to avoid confusion or errors in the analysis. Creating a data table with the same data type will allow functions to evaluate. You cannot perform math functions if you have a column of ages, but some values are text, not numbers. If some of your measurements are on the Fahrenheit (°F) scale, Celsius (°C) scale, and Kelvin (K) scale, for example, you may need to standardize them to allow comparisons and analysis.
Check for accuracy—Verify the accuracy by comparing it with external sources, such as official statistics or other datasets. (Source: Data Preprocessing and Cleaning Techniques for Environmental Data -(rtei.net)) Critically examine information or a source you are not familiar with. Having first-hand research to use as a spot check is always great.
Remember to use your end-users or data stewards for assistance. They have experience with the datasets, which can be invaluable.
Validate data—Validate the data by running quality control checks to ensure it meets the defined criteria for accuracy and completeness. Always spot-check calculations and information. Have various teams been involved in writing testing criteria?
Do your totals include all the information? Do you have a filter? One great check is to have a counter. If I have 25 values in one list and 25 in the second, I should have 50 when I combine them. Balance or Cross-Footing totals are always a great validation. See great visuals for more information – What is footing and cross-footing? – Universal CPA Review
Document the process—If I had a dollar for every time I needed to revisit how something was done. I would document the steps taken to clean the data, including any decisions made and any assumptions or modifications made in the process. You should also get a sign-off and review of your decisions with data owners.
Make that documentation available to others who use your data. This is an excellent beginning for handover documentation. This helps increase trust in your process and is backed up when discussions about issues arise. Also, keep track of different versions of your documents. Think of an auditor coming back 2 years later and asking how you came up with a number. It could be a report someone used your data as a source, for example, and they may need to justify a decision made.
Ensuring data accuracy, reliability, and consistency through these steps is crucial for conducting analysis.
AI and the Art of Data Cleaning – Precision in the Pursuit of Purity
Data cleaning, often considered the most laborious part of data science, is where AI can revolutionize the process. AI algorithms, equipped with machine learning, take on the task of data cleaning with a level of precision and efficiency that can be unmatched by traditional methods. At this stage, AI transforms the art of data cleaning into a systematic, streamlined, and surprisingly intelligent operation.
Automated Anomaly Detection
AI algorithms begin their cleansing process with anomaly detection.
Machine learning models, especially those designed for unsupervised learning, are proficient at identifying data points that deviate from the collective pattern. Using statistical, clustering, or neural network-based approaches, these models scan the dataset for outliers.
Whether it’s a typographical error in a customer’s email address or an implausible value in a financial transaction, AI algorithms can flag these anomalies at scale; something manual processes could never achieve with the same speed or accuracy.
Context-Aware Error Correction
The true power of AI in data cleaning lies in its ability to detect and correct errors. Context-aware algorithms analyze surrounding data to propose the most likely corrections. For example, an AI algorithm might identify that a zip code does not match the associated city name and can automatically suggest the correct value. These corrections are based on learned data models and can be quite nuanced, taking into account various factors that a human might overlook.
Pattern Recognition for Data Consistency
Pattern recognition is another skill AI uses in data cleaning. AI algorithms learn from consistent patterns in data to enforce standardization across datasets. These intelligent systems help align any inconsistencies in formats, such as date-time stamps. By recognizing and applying these patterns, AI ensures that the dataset is error-free and homogenous in its representation, making it ready for analysis.
Predictive Data Cleaning
Predictive data cleaning, analyzing trends, and historical corrections. These AI algorithms can predict where errors are likely to occur next. This predictive capability allows for preemptive cleaning, ensuring that the data remains clean not just at the moment but maintains its integrity over time.
Self-Learning Systems for Continuous Improvement
A key feature of AI in data cleaning is its self-learning capability. Learning from previous cleaning cycles, the algorithms become more accurate and efficient with every iteration. This means that the system continuously improves, reducing the need for human intervention and making the process more reliable and error-prone.
AI algorithms have not just simplified data cleaning; I believe they have redefined it. From anomaly detection to automatic error correction, AI ensures that datasets are clean and pristine. This level of data purity is a prerequisite for high-quality analytics and machine learning models, and AI achieves it by automating the previous manual methods.
Stage 5. What is Data Transformation?
Data transformation involves converting data from its initial format or structure to another for analysis. This process includes filtering, restructuring, and combining different data sources to create data suitable for answering the questions.
Here are some examples of data transformation:
Data aggregation—Aggregating data involves summarizing it by grouping it into categories or subsets. Be careful when you do calculations and summaries. Downstream analytics may need the details that make up the new totals or calculations. Getting rid of more information is always hard.
Data normalization – Normalizing data involves transforming it to a common scale or format so it looks and reads the same across the set. This may involve;
Scaling data to a common range, such as between 0 and 1
Converting categorical data to numerical values.
Converting phone numbers from xxxxxxxxxx to xxx-xxx-xxxx by putting in dashes.
Creating a common date format may be the most challenging aspect. This article from 2003, Normalizing Dates – SQLServerCentral, never gets old and is well worth the read.
Data Restructuring—Restructuring data involves changing its structure or format. This may include pivoting data to a wide or long format, transposing data from rows to columns, or vice versa.
Think of a table of Rows of Stores by Months as Columns. You could transform this to Months on rows and Stores on Columns to match how your users will analyze this data. Consider how your analysts will use the data to determine the best format.

When you start exploring visually, your visual learning reflexes will bring relationships into view.
Image by Lorenzo Cafaro from Pixabay
Using ML in Data Transformation
The transformation stage of data preparation is where raw data undergoes a transition into a form primed for analysis. Machine Learning (ML) techniques play the role of the modern alchemist, turning the leaden mass of raw data into analytical gold. Among these techniques, autoencoders stand out for their ability to refine and denoise, serving the crucial function of combining and simplifying raw data.
Autoencoders: Unveiling the Essence of Data
Autoencoders are a type of neural network designed to learn efficient representations of data, typically for the purpose of dimensionality reduction. They work by compressing the input into a lower-dimensional latent space and then reconstructing the output to match the original input as closely as possible. Through this process, they capture the most salient features of the data, effectively filtering out the noise and reducing the complexity of the dataset.
(Source: Development of machine learning techniques and evaluation of analysis results — The University of Aberdeen Research Portal (elsevierpure.com))
This ML technique is particularly useful when dealing with high-dimensional data, such as images or complex sensor readings, where the true signals are hidden in the vast expanse of information. By distilling the data into its most informative features, autoencoders facilitate a more focused and efficient analysis, making them a potent tool in the data scientist’s arsenal.
Feature Engineering with ML
Beyond dimensionality reduction, ML techniques also excel in feature engineering, where they automate the creation of new variables that can better represent the predictive signals in a dataset. Decision trees, for instance, can identify and create thresholds that split the data in ways that are most informative for prediction. Similarly, algorithms like principal component analysis (PCA) can create new features that are linear combinations of the original set, capturing maximum variance and, hence, more insight.
(Source: An Improvement Algorithm of Principal Component Analysis | IEEE Conference Publication | IEEE Xplore)
Transformation for Normalization and Scaling
Normalization and scaling are also crucial components of data transformation. They ensure that the numerical values within a dataset have a common scale without distorting differences in the ranges of values. ML algorithms apply min-max scaling and standardization techniques to adjust the data, which is essential for models sensitive to the input scale, like support vector machines or k-nearest neighbors.
Automating the Transformation Process
Their ability to automate the process sets ML techniques apart in data transformation. They learn from the data which transformations yield the most predictive features, thereby streamlining the preparation steps for future analysis. This automation accelerates the process and ensures consistency and repeatability in data transformation across different datasets and analytical projects.
ML techniques like autoencoders and others transform data into a ready-to-analyze state. They serve as the crucibles in which the raw data material is refined, the dross removed, and its essence made clear for analytical endeavors. In Stage 5 of data preparation, these techniques are indispensable in sculpting the data into a form that can reveal the deep insights that organizations seek.
Stage 6. What is Data Integration?
Once the data is clean, you can combine it from multiple sources and ensure it’s in a consistent format and structure. The process of combining data into a single dataset, or Integrating data, involves combining data from different sources into fewer (or single) datasets. This may involve merging datasets based on common variables or creating new variables based on the combined data.
It is always a good practice to process the data as close to the source as possible. The source system is usually more powerful than the Excel worksheet the analyst may use. Watch out for downstream analysts who must repeat the same process steps to use the same dataset. This is almost always a group effort.
A good example of this is Employee and Sales system data. Creating a view or data set, including sales and employee data, allows bonus calculations and payments. In this example, be careful of the different security and rules of each system you work with. Some users have rights to Employee data, and some may have rights to Sales data. Combining the two may become the rights to this new data set.
The following are important elements of data integration.
Data sources – Identify the different sources of data that need to be integrated, such as databases, spreadsheets, or APIs. The key to success is getting each data set into a unified format and selecting tools to connect and orchestrate the process.
For instance, it may be necessary to integrate an Azure SQL store and an Oracle database. The most difficult aspect may be ensuring security and access. The data could be exported to a common format, for example, CSV or Apache Parquet, an open-source column-based data file format designed for efficient storage and retrieval.
Data mapping – This is the process of connecting fields from one database to another. It must be completed accurately, as mistakes could cause a domino effect on the data flow. For example, one table could have a Delivery Date and another an Order Date, but both source systems are labeled date.
Every element must be mapped in a common format or schema for analysis by recognizing similar variables and resolving discrepancies. Field names and formats must be considered, especially on columns that map or join the data.
Data Transformation – The data you combine may have been transformed already, making your job easier. However, handling further transformations as you process the exchange is a common task. The goal becomes ensuring that your result remains consistent and accurate.
This may involve cleaning the data, handling missing values, and normalizing the data based on the new combination of data. For example, how do you handle missing values? Do they become a zero, null, or other value? The fact that there is no data point may be a useful analysis point downstream.
Data loading – This step involves Loading the transformed data into a single repository, such as a data warehouse or data lake. This process can be the most complex and must be robust and traceable. One of the gotchas that people fall into is not planning for repeatability.
Several important things to remember are:What do you do with the original files?
What happens when you have an error? Do you skip it or stop the process?
Do you need to have incremental updates? If so, how do you determine what data is new?
Do you need to track the changes from one load to another? This can be important for auditing and your Data Scientists who need to explain model changes.
Do you have to change the data structure of each system to include a load flag or date loaded?
Data quality—Ensure that the integrated data is of high quality by verifying its accuracy, completeness, and consistency. It is very important to check the joined data. Did the joins come together correctly?
Scalability and Performance – Design your data loading process to handle large volumes of data and accommodate future growth. Optimize performance by using techniques like parallel processing, batching, and indexing.
Check if there will be an initial history load. I have found teams that design for regular loads, but as the system is deployed, you could have years of data to be processed and loaded. Can the system you design handle that? Will the transaction log balloon?
It is vital to monitor system performance and proactively address bottlenecks or other issues that may slow the process as the data grows.
Error Handling and Recovery—Implement robust error-handling procedures to manage issues that may arise during data loading. This includes logging errors, retrying failed operations, and providing clear error messages to users. Develop a recovery plan to handle potential data loss or corruption, ensuring minimal impact on your system and data integrity.
Create logs and change control lists during your process. Life is so much easier when you can trace your process. Be careful, however, as exposure of sensitive data in your error, log files, and database backups have affected many individuals.
Security and Compliance – Defend your data loading process against unauthorized access and breaches. Implement proper access controls, encryption, and data masking as needed. The location of your source data should be secured and protected the same way as your production data. Securing payroll data in the system cannot be put in danger by having the Data Lake, for example, have wider access.
Ensure your process complies with relevant data protection regulations and industry best practices, such as GDPR or HIPAA. Regularly review and update security measures as threats evolve.
Data governance—Establish policies and procedures to ensure the integrated data is managed and used securely and ethically. As data usage and sharing continue to grow within organizations, it is important to balance governance with the need for innovation and impactful solutions, whether on-premises or in the cloud.
Establishing a set of Data Governance Principles is crucial for ensuring data’s safe and appropriate use in achieving success. This will help your team not to reinvent the wheel every time they start a project.
More information on Data Governce can be found on this site; How to Create a Data Governance Framework: Best Practices and Key Components
Data integration is critical in data analysis because it allows analysts to access and analyze data from multiple sources. By integrating data, analysts can gain a more comprehensive view and identify patterns or relationships that may not be apparent from individual sources.
AI as the Great Unifier in Data Integration
The data integration challenge takes center stage as diverse datasets converge in the data preparation pipeline. This phase resembles assembling a complex jigsaw puzzle where each piece comes from different boxes. AI serves as the great unifier in this scenario, wielding algorithms that fit these pieces together and ensure that the picture they form is coherent and complete.
Harmonizing Data from Disparate Sources
The first task in data integration is to harmonize data from disparate sources. AI does this with a finesse that is hard to replicate manually. Using machine learning algorithms, it can recognize and reconcile differences in data formats, naming conventions, and units of measurement. AI models trained on domain-specific data can interpret various data fields, translating them into a unified schema. For instance, an AI system can understand that “DOB,” “Birth Date,” and “Date of Birth” all refer to the same attribute and align them within a single, cohesive dataset.
Resolving Data Discrepancies
More than just matching labels and formats, AI goes deeper to resolve discrepancies in data values. It employs sophisticated algorithms to detect and rectify conflicts—such as different addresses for the same customer—by cross-referencing data points and employing probabilistic models to ascertain the most likely accurate information.
Linking Data with Entity Resolution
A crucial component of AI in data integration is entity resolution, which involves identifying and linking multiple records corresponding to the same entity across different databases. AI employs clustering techniques, such as hierarchical clustering or graph-based models, to group related records by analyzing their relationships and similarities. These techniques are particularly effective when no common key or identifier is shared across datasets.
Automating Data Transformation for Integration
AI streamlines data transformation for integration purposes as well. It can automatically apply necessary conversions to align data types and structures, enabling smooth merging and joining of datasets. For example, AI-driven processes seamlessly convert all dates to a standard format or ensure that numerical values are in the same unit system across datasets.
Facilitating Continuous Integration
In the era of big data, data integration is not a one-off event but a continuous necessity. AI systems are designed to facilitate this ongoing requirement, enabling real-time or near-real-time data integration that keeps pace with the constant influx of new data streams. This agility ensures that the integrated datasets are always current and reflect the latest information.
AI is proving indispensable as a catalyst in unifying diverse data into a single, analysis-ready repository. By resolving discrepancies and automating the transformation and integration processes, AI enables data scientists and analysts to proceed confidently, knowing that the dataset they work with is an accurate and unified representation of the information at hand.
Stage 7. What is Data Enrichment?
Data enrichment is the process of adding to existing data with additional information to provide a more complete and useful dataset for analysis. This can involve adding new variables or features to the dataset.
Here are some examples of data enrichment:
Adding External Data—Adding data from external sources, such as demographic or economic data, can provide additional context and insights into the dataset. For example, I produced a set of retail analyses by store and combined them with weather data from each location. This allowed for more detailed analysis and forecasting and better results.
Geocoding – Geocoding involves adding geographic coordinates to the dataset, which can be used to analyze based on location. Combining customer location with other demographic, social, or environmental data allows exploring relationships and trends that might not otherwise be visible.
I was recommended this article by one customer who put the importance of this into practice. Geocoding large population-level administrative datasets at highly resolved spatial scales – PMC (nih.gov)
Text Mining – Since the birth of Big Data and Data Mining, Text Analytics has been the mainstay of machine learning. One of the most important uses is sentiment analysis, which involves analyzing text data, such as social media posts or customer feedback, to extract insights and sentiment analysis.
Another example is a Recommender System, which predicts user preferences or interests based on their historical data, behavior, and interactions with a platform. The system uses machine learning algorithms to analyze user data and recommend various items, including movies, music, books, products, and services. The key is to help users find relevant and engaging content.
Image or video Analysis – Analyzing image or video data can provide additional insights into the dataset, such as identifying objects or patterns.
Data enrichment can help organizations better understand their data and make more informed decisions based on the insights gained. Analysts can identify patterns and trends that may not be apparent in the original dataset, leading to new opportunities and strategies for the organization.
AI-Infused Enrichment: Crafting a Fuller Picture into Data Narratives
In the data preparation process, enrichment is the stage where data is not merely cleaned or organized but enhanced to draw out deeper insights. AI-driven data enrichment is a transformative step that breathes life into datasets by infusing them with additional context and dimensions. This stage is about expanding the dataset’s potential, and AI models are at the forefront of this expansion, bringing the power of synthetic data generation and enrichment to the fore.
Synthetic Data Generation
Synthetic data generation stands as a pinnacle of AI’s role in data enrichment. AI models, especially Generative Adversarial Networks (GANs), can generate synthetic data points that closely resemble the statistical properties of original datasets. This is crucial for handling sensitive data where privacy is paramount, or when existing data is too limited to develop strong machine learning models. By serving as an additional resource, synthetic data enhances model training with a broader and more varied dataset.
Source( [2403.00861] Pivoting Retail Supply Chain with Deep Generative Techniques: Taxonomy, Survey and Insights (arxiv.org))As an example, I used Copilot to rewrite and summarize the reference above.
Contextual Enrichment
AI also facilitates contextual enrichment by integrating external datasets that add valuable context to existing data. For example, an AI system might enhance a retail company’s sales data with weather information to analyze the impact of weather patterns on sales trends. Machine learning models can automatically identify relevant external data sources, evaluate their relevance, and integrate them to provide a multi-dimensional view.
Semantic Enrichment
Through natural language processing (NLP), AI enriches data semantically. It can tag and categorize text data, extract sentiment, and even identify entities and relationships within unstructured data. This enrichment brings a level of understanding and accessibility to text data, allowing for more sophisticated analysis, such as trend detection in customer feedback or thematic analysis in large volumes of textual content.
Predictive Enrichment
AI goes beyond the present state of data, offering predictive enrichment by forecasting future trends and scenarios based on historical data. Predictive models can add time-series forecasts or propensity scores to a dataset, allowing analysts to project future events or behaviors, thereby making the data not just a record of the past but a map of the future.
Quality Enhancement
In addition to augmenting data with new dimensions, AI ensures the enhanced data maintains high quality. It applies the same rigorous standards of cleaning and validation to the enriched data as it does to the original set, ensuring that the enrichment process does not introduce noise or errors.
AI truly distinguishes itself by augmenting datasets with additional layers of information and ensuring that this enriched data is primed for extracting meaningful and actionable insights. By generating synthetic data and integrating contextual, semantic, and predictive elements, AI-driven data enrichment transforms the raw material of data into a rich tapestry, ready to be woven into the narrative of informed decision-making.
Stage 8. Operationalization – Let’s Do This Again
Operationalizing Data Preparation involves automating and streamlining the tasks to improve efficiency, repeatability, and scalability. When you are successful, people will come back and ask for updates or for you to do it again.
There are several methods to operationalize data preparation, including:
Great Documentation – Having your process documented, online, and available will not only cut down on the questions but will allow you to gain trust by having an open process. See Wikimedia Blog/Converting wiki pages to blog posts – Meta on converting Blog Posts to Wiki pages.
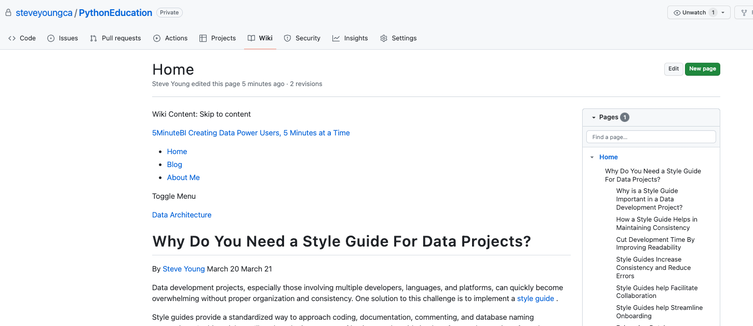
PythonWiki
Data pipelines – Data pipelines are automated workflows that move data from source systems to target systems while transforming and processing it along the way. They are essential for any data analyst as they allow for efficient and accurate data movement from source systems to target systems. Data pipelines can help streamline the data preparation process.
(Great Source and Site!! Data Integration – AI ML Analytics (ai-ml-analytics.com))
Data integration platforms – Data integration platforms are software tools that help organizations integrate data from various sources and prepare it for analysis. They enable organizations to access, transform, and consolidate data from multiple sources into a single repository. This is done by providing an easy-to-use interface that allows users to connect different data sources and manipulate the data to their needs. Users can then use this prepped data for various purposes, such as analytics, reporting, or machine learning.
The Autonomous Backbone: AI in Data Operationalization
The final stage of data preparation is operationalization, where prepared data becomes part of automated workflows, ready for repeated analysis and application. In this crucial stage, AI stands out not just as an enabler but as the driving force that propels data processes from the back end to the front lines of decision-making, all with minimal human oversight.
Automating Workflows with AI
In operationalization, AI can automate the entire workflow of data preparation tasks. These tasks range from routine scheduling of data imports and exports to more complex tasks, such as dynamic data validation and real-time error handling. AI-driven systems are programmed to trigger these tasks based on a set of rules or predictive models that determine the best times and conditions for execution, ensuring that data pipelines are constantly fed with clean, transformed, and enriched data.
Intelligent Scheduling and Execution
The true prowess of AI in operationalization is showcased in its capacity for intelligent scheduling. AI systems analyze patterns in data usage, system load, and even the ebb and flow of business cycles to optimize the timing of data preparation tasks. They then autonomously execute these tasks, such as running ETL (Extract, Transform, Load) operations during off-peak hours to minimize the impact on system resources or triggering data refreshes in response to specific business events.
Continuous Monitoring and Adaptation
AI’s role in operationalization extends to continuous monitoring and adaptive learning. By keeping a vigilant eye on data pipelines, AI systems can detect shifts in data patterns or changes in system performance, adapting the operational workflows accordingly. This ensures efficiency, resilience, and scalability in data operations as AI systems learn and evolve with the organization’s needs.
Facilitating Collaborative Data Ecosystems
Beyond individual tasks, AI facilitates the orchestration of complex, collaborative data ecosystems. It enables different components of the data architecture to work in concert, aligning data lakes, warehouses, and marts to serve up-to-date information to BI tools, analytics platforms, and machine learning models. This orchestrated approach is pivotal for organizations that leverage real-time analytics or embed data-driven intelligence into their products and services.
The Human-AI Partnership
While AI takes on most operational tasks, the remaining human oversight is elevated to a strategic level. Data scientists and engineers oversee the AI systems, fine-tuning algorithms and workflows to align with changing business strategies and data landscapes. This human-AI partnership ensures that while the operationalization is mainly autonomous, it remains under the strategic guidance of those who understand the broader business context.
In this final stage, AI crystallizes its value in the data preparation, transforming it into an autonomous, self-optimizing system that schedules and executes tasks with precision and foresight. This final stage is not just about doing without human intervention but about elevating the role of data within an organization to be a seamless, integrated force in driving business intelligence and innovation.
Conclusion
By investing time and effort into data preparation, organizations can improve the quality of their data and gain a competitive edge in their industry.
Data preparation is an essential step in the data analysis process that involves cleaning, transforming, and integrating data to create a suitable dataset for analysis. It requires careful planning, attention to detail, and appropriate tools and techniques.
Proper data preparation allows analysts to obtain comprehensive insights and make well-informed choices. This iterative process may require analysts to revisit it several times during analysis. By investing time and effort into data preparation, organizations can improve the quality of their data and gain a competitive edge in their industry.
(Source: The Unrealized Value of Maintaining Clean Data – RDA Systems)
AI has not just changed the game; it has redefined how we prepare data. This new age of AI-driven data preparation is characterized by speed, efficiency, and an unparalleled ability to adapt. We have always been trying to imbed these qualities in our data workflows. As we collect more data to feed these AI needs, the AI-augmented data preparation process will be a cornerstone of their ability to derive actionable insights, maintain competitive edge, and fuel data-driven decision-making.